TANF data shouldn’t be a post-mortem.
Most reporting tells you what happened weeks ago. Sigmoid Nexus helps teams understand what’s happening now — and stress-test what happens next — using cohort-grade history and a configurable synthetic data engine.
Built for the reality of state programs: shifting extracts, local policy variation, and stakeholders who need different views of the same numbers — without forking the truth into spreadsheets.
From fragmented reports to coherent history
We treat published reporting as a starting point — then rebuild continuity, context, and analytic usability so the data can drive decisions.
In the real world, TANF data is often fragmented, messy, and effectively forgotten once reports are compiled and transmitted to ACF. Files change, context is lost, and months of work collapse into static tables that are difficult to revisit or build upon. The result is a waste of valuable insight and institutional knowledge.
At Sigmoid, we took a different approach. Instead of treating each reporting month as a disconnected artifact, we rebuild a longitudinal system that can be analyzed, compared, and stress-tested over time.
Sigmoid Nexus reconstructs longitudinal, case/family and participant-level history from the published source of truth, preserving continuity across months and federal fiscal years.
By rebuilding history as a coherent system rather than a series of disconnected reports, we create a foundation where trends, cohorts, and policy outcomes can actually be understood — and used.
That foundation matters now more than ever. As the original welfare-to-work program, TANF contains decades of real-world evidence on work requirements, sanctions, exemptions, and outcomes. Preserving and analyzing that history provides critical context at a time when similar policy questions are increasingly being asked across other safety-net programs.
The data exists. The insight doesn’t.
Every state submits TANF data to ACF. But turning that data into something useful — fast — is where things fall apart.
- Caseworkers can’t see which clients are at risk of churn
- Analysts spend weeks cleaning files before analysis begins
- Directors find out about WPR problems after it’s too late to fix them
- Legislators ask “what if we changed X?” and nobody can answer in time
A practical decision-support layer for TANF.
Not generic BI with TANF terminology bolted on. We started with state realities and worked backward to the architecture.
First solve: month-to-month continuity — keeping cases and people consistent even when extracts drift. That’s what makes cohort and churn analysis reliable.
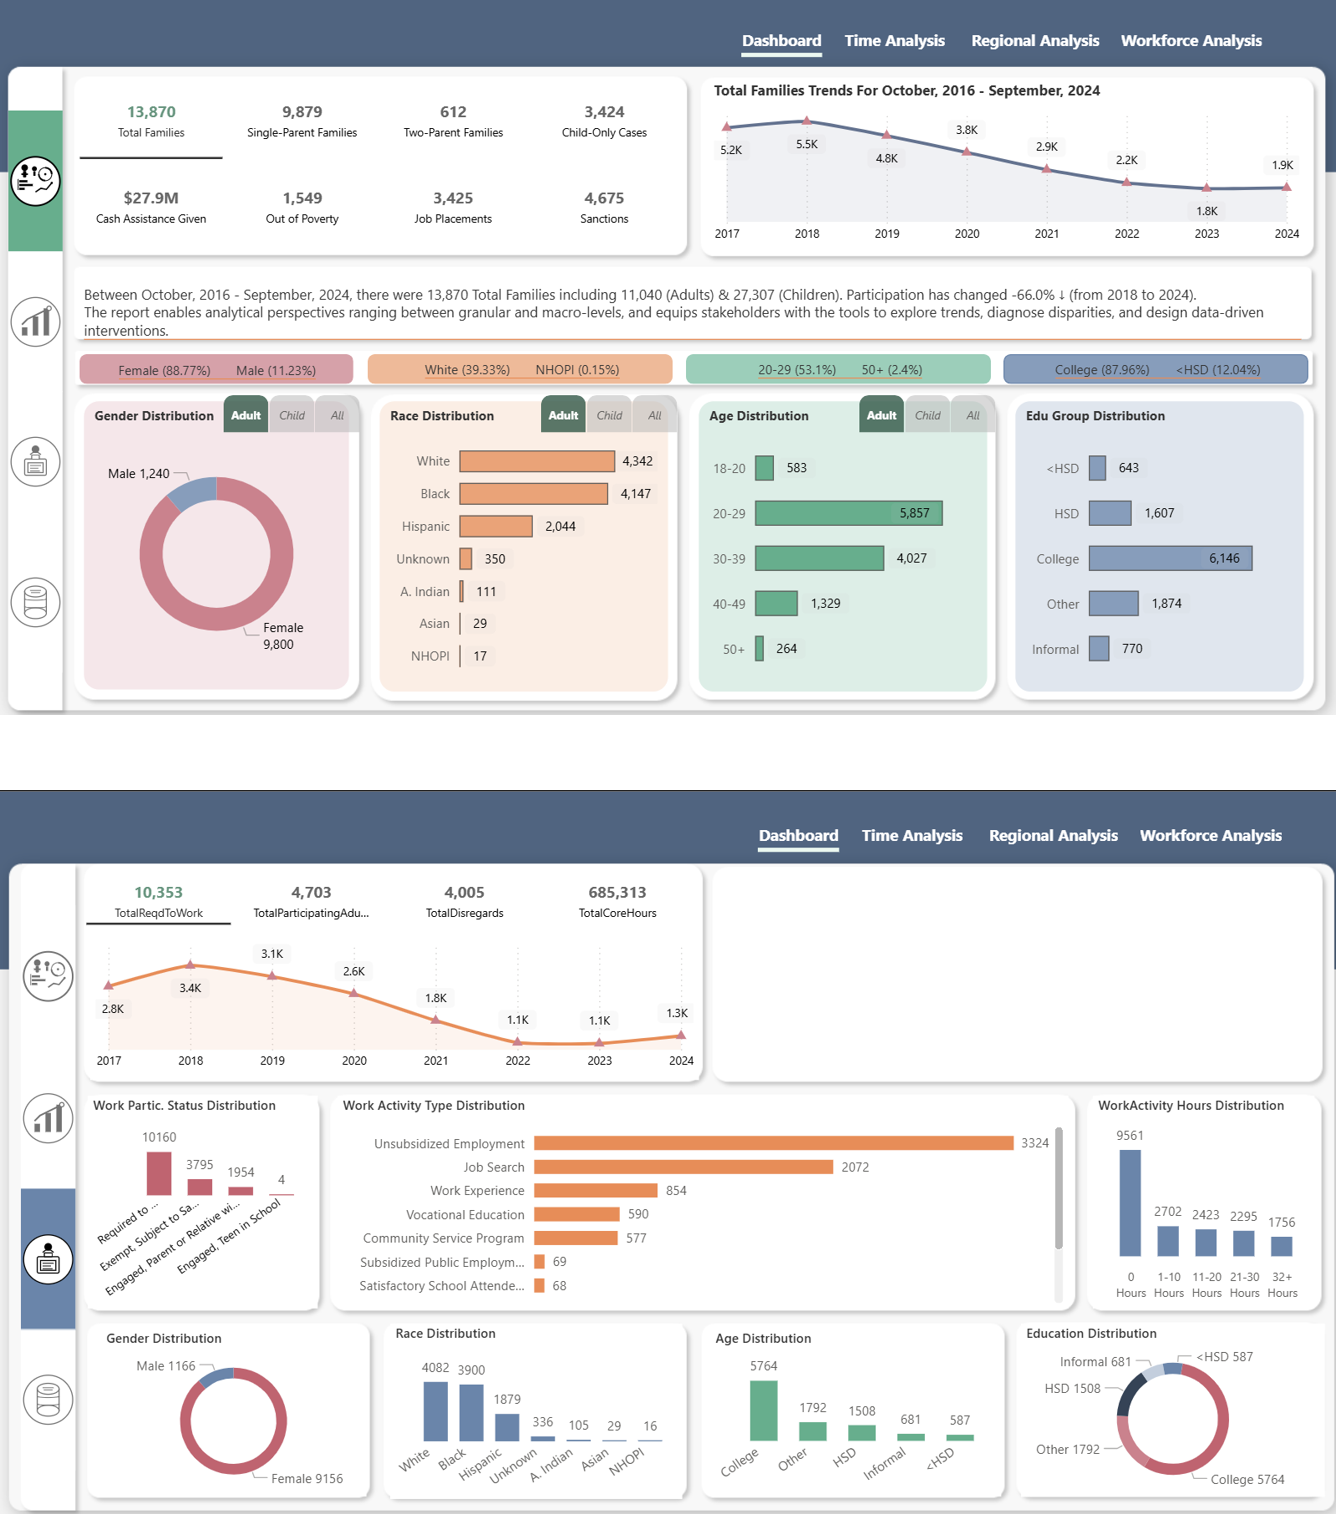
Core build today: WPR/CRC drivers, opens/closes, cohort entry/exit, sanction progression — plus drilldowns by county and demographic dimensions.
Multi-state ready: modeled policy profiles for Arkansas, Tennessee, and Minnesota so onboarding doesn’t start from zero.
Synthetic Data Engine
Run realistic policy simulations without exposing PII. Calibrate caseloads to your state’s demographics, sanctions, and county patterns.
Cohort Integrity
Track families across time (not just monthly snapshots). Compare entry cohorts, churn, and outcomes with confidence.
Local Calibration
Encode policy quirks in configuration (not hard-coded logic). Test changes quickly and keep assumptions auditable.
Synthetic data that matches your state’s reality
Need to test a policy change before implementation? Our microsimulation generates synthetic caseloads calibrated to your population and program behavior. Researchers get realistic data without touching PII. Policy teams can model “what-if” scenarios against distributions that reflect your state.
We’ve prototyped Arkansas (5-phase sanctions, Work Pays extensions), Tennessee (re-entry logic), and Minnesota (linear progression) — spanning a spectrum of sanctions policy variation. State teams can configure and test policy logic quickly.
Month-over-month tracking that catches problems early
WPR and CRC aren’t just annual compliance numbers. We track them monthly with enough lead time to act. When a subgroup starts slipping, you see it before it shows up in end-of-year reporting.
Scenario planning that answers real questions
What happens if unemployment spikes? What if work requirements tighten? Which counties feel it first? The scenario planner runs projections against your baseline — not generic national averages — and produces briefing-ready outputs.
Deployment on synthetic data: typically under 30 days (timing varies with policy configuration and stakeholder review). Real-data integration depends on access, file consistency, and governance.
Core modules
Four components, one platform. Use what you need.
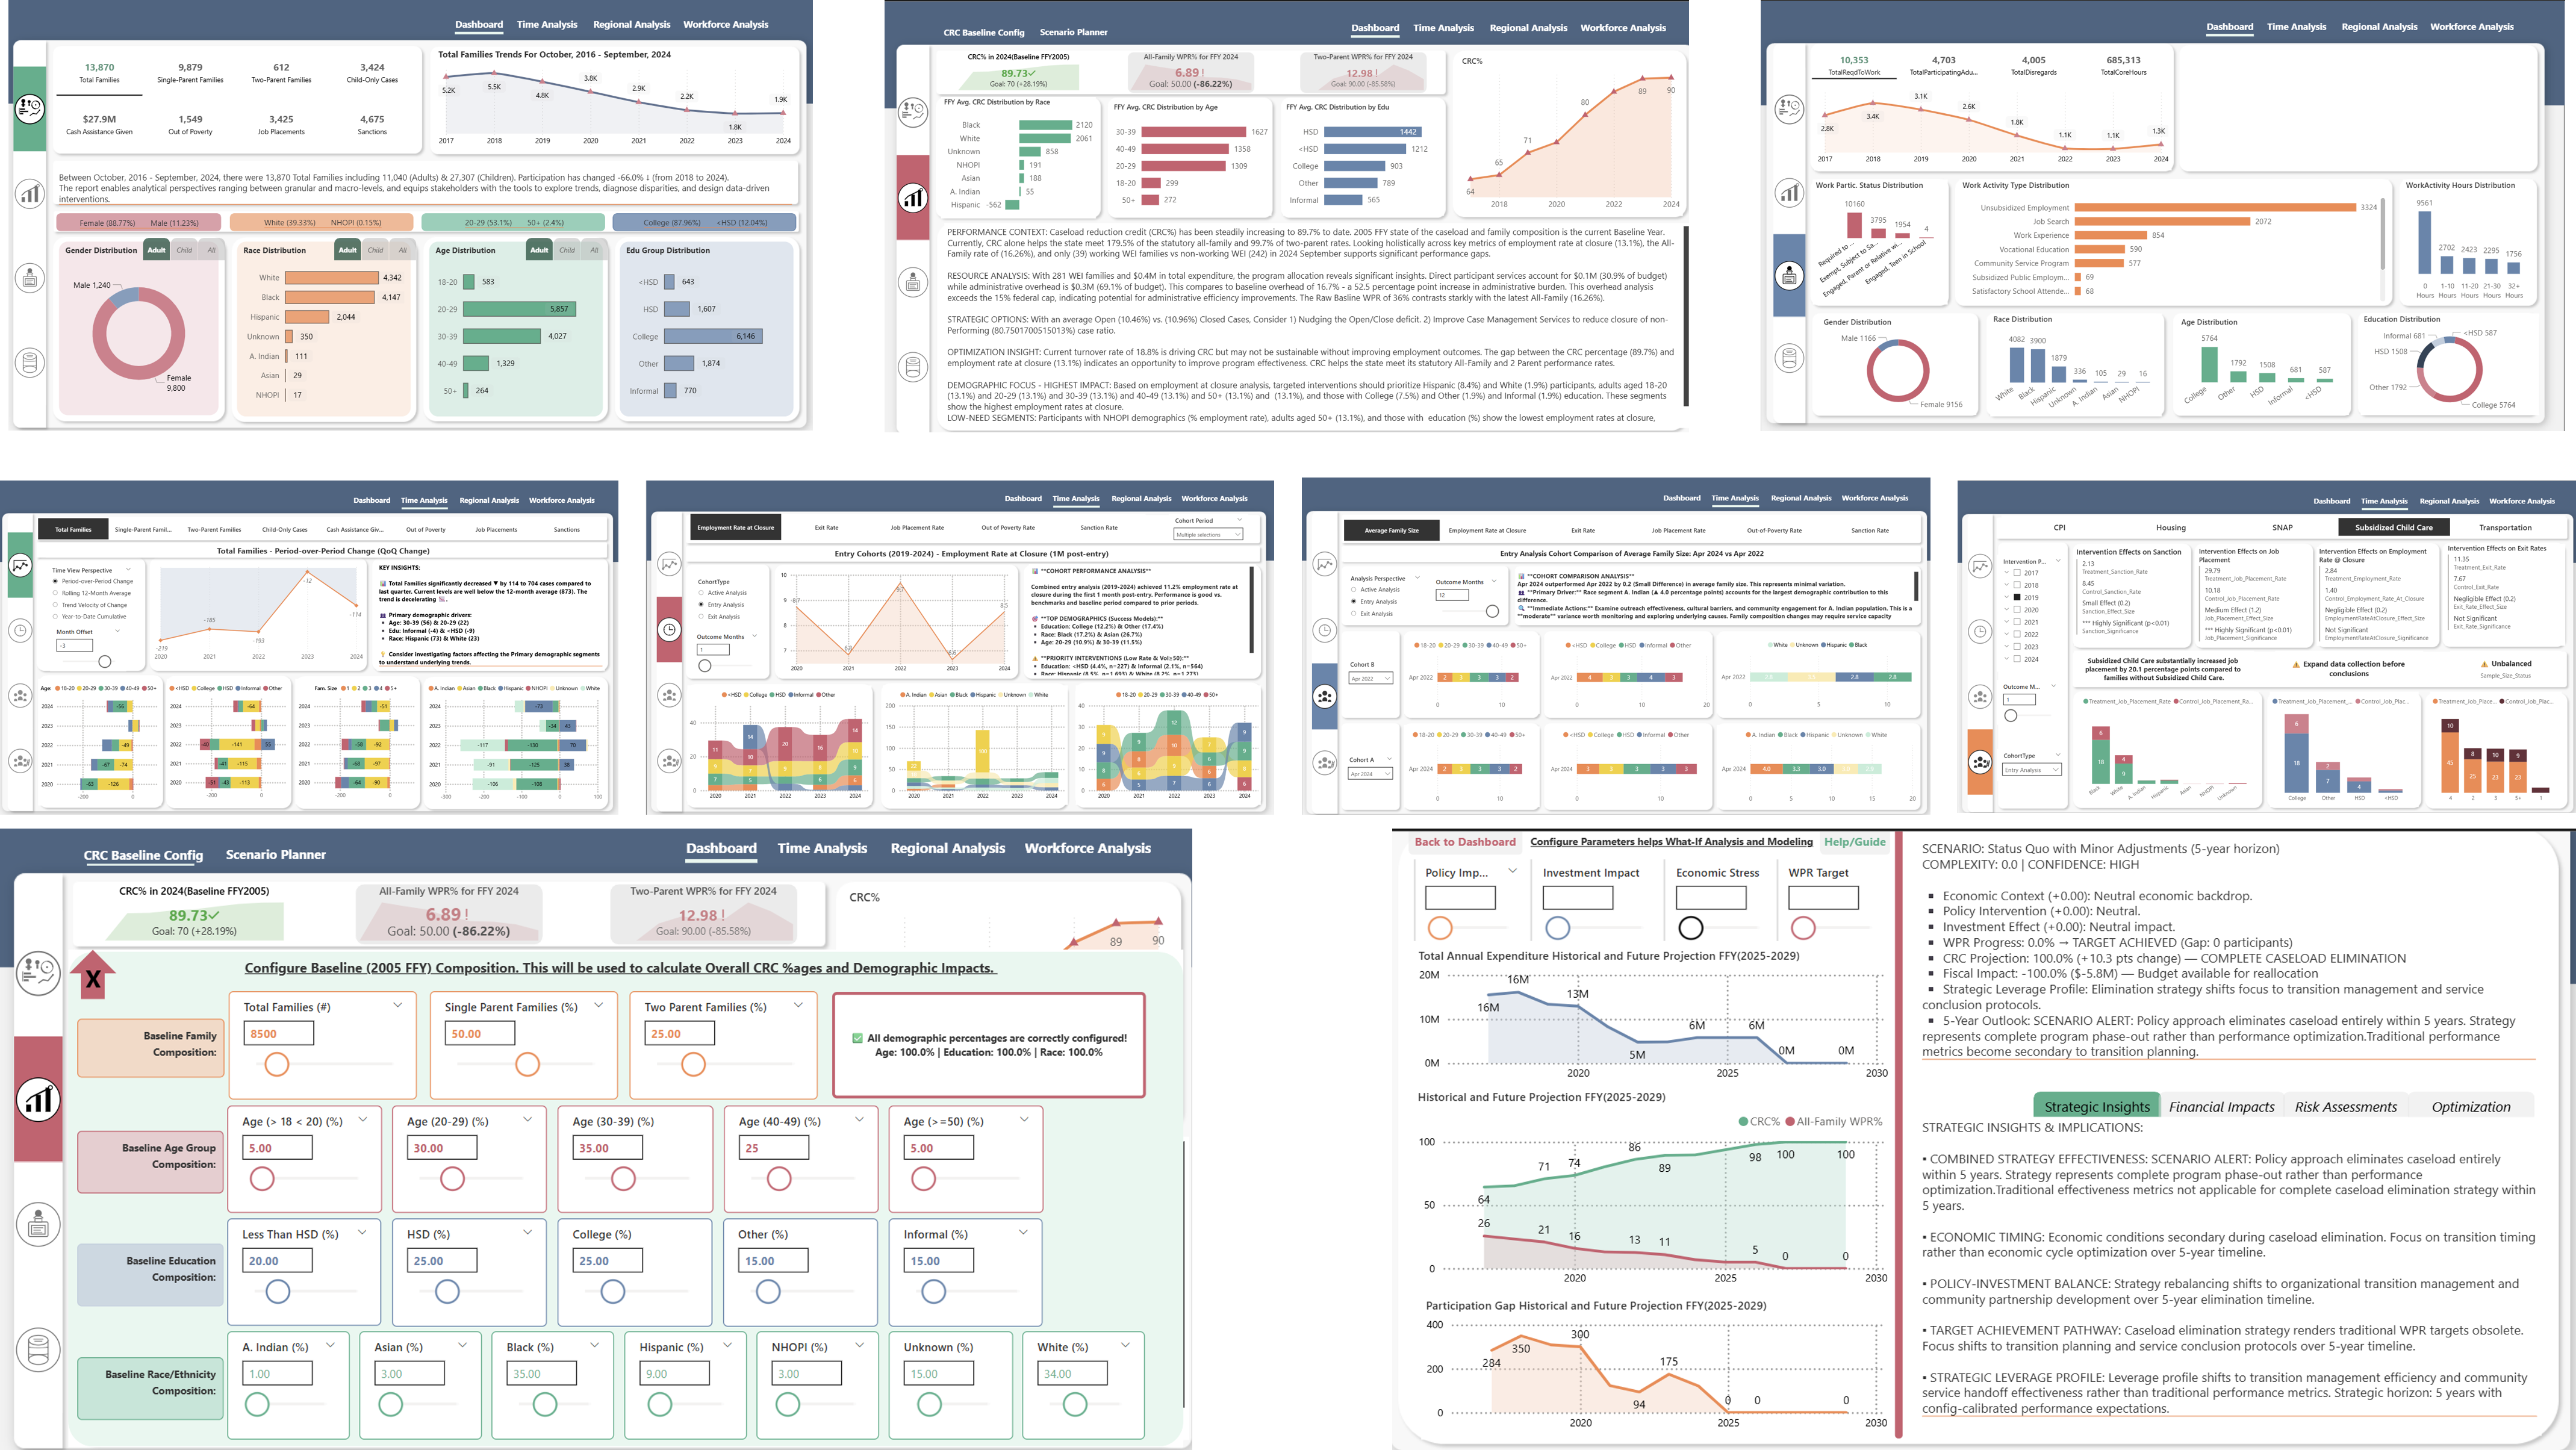
Dashboard Summary
Cross-FFY comparisons on topline metrics. Filter by demographics, county, time period. Exportable for briefings.
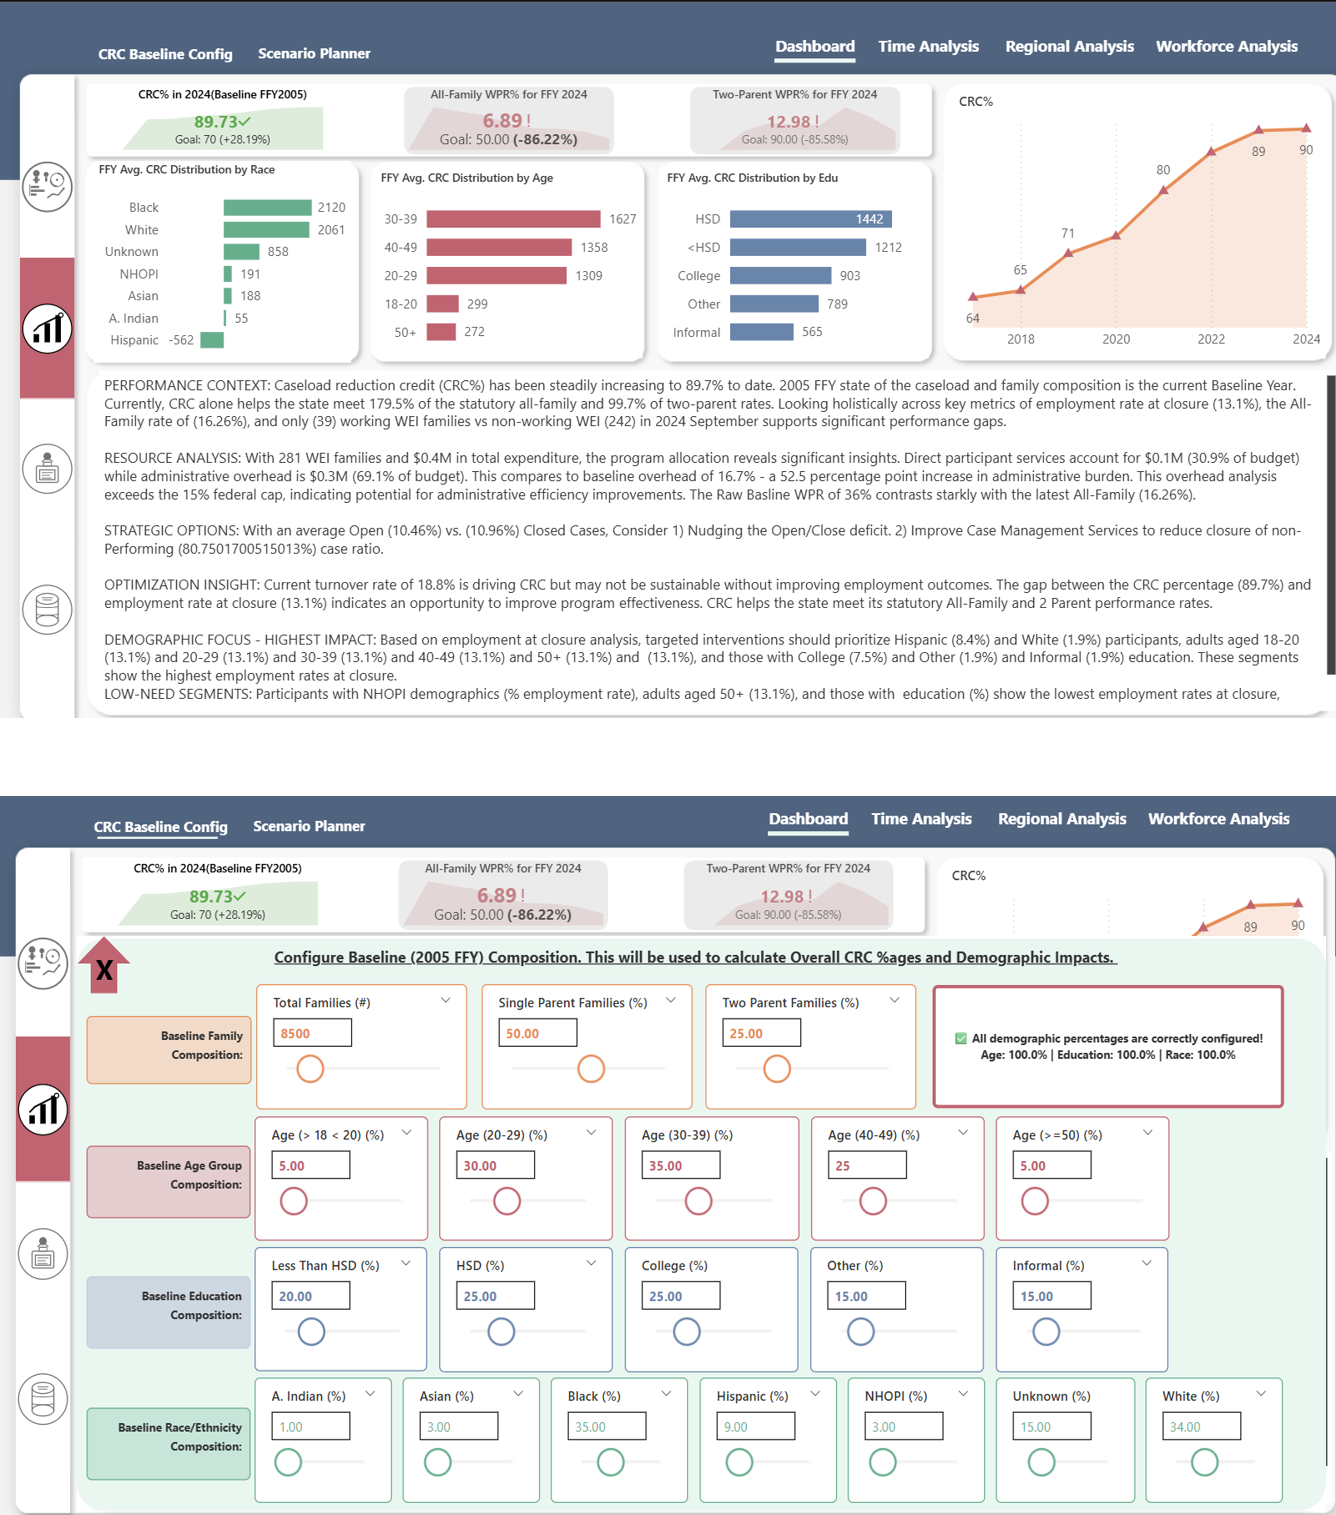
KPI & Scenario Planner
WPR/CRC breakdowns with configurable what-if modeling. See which interventions move which numbers.
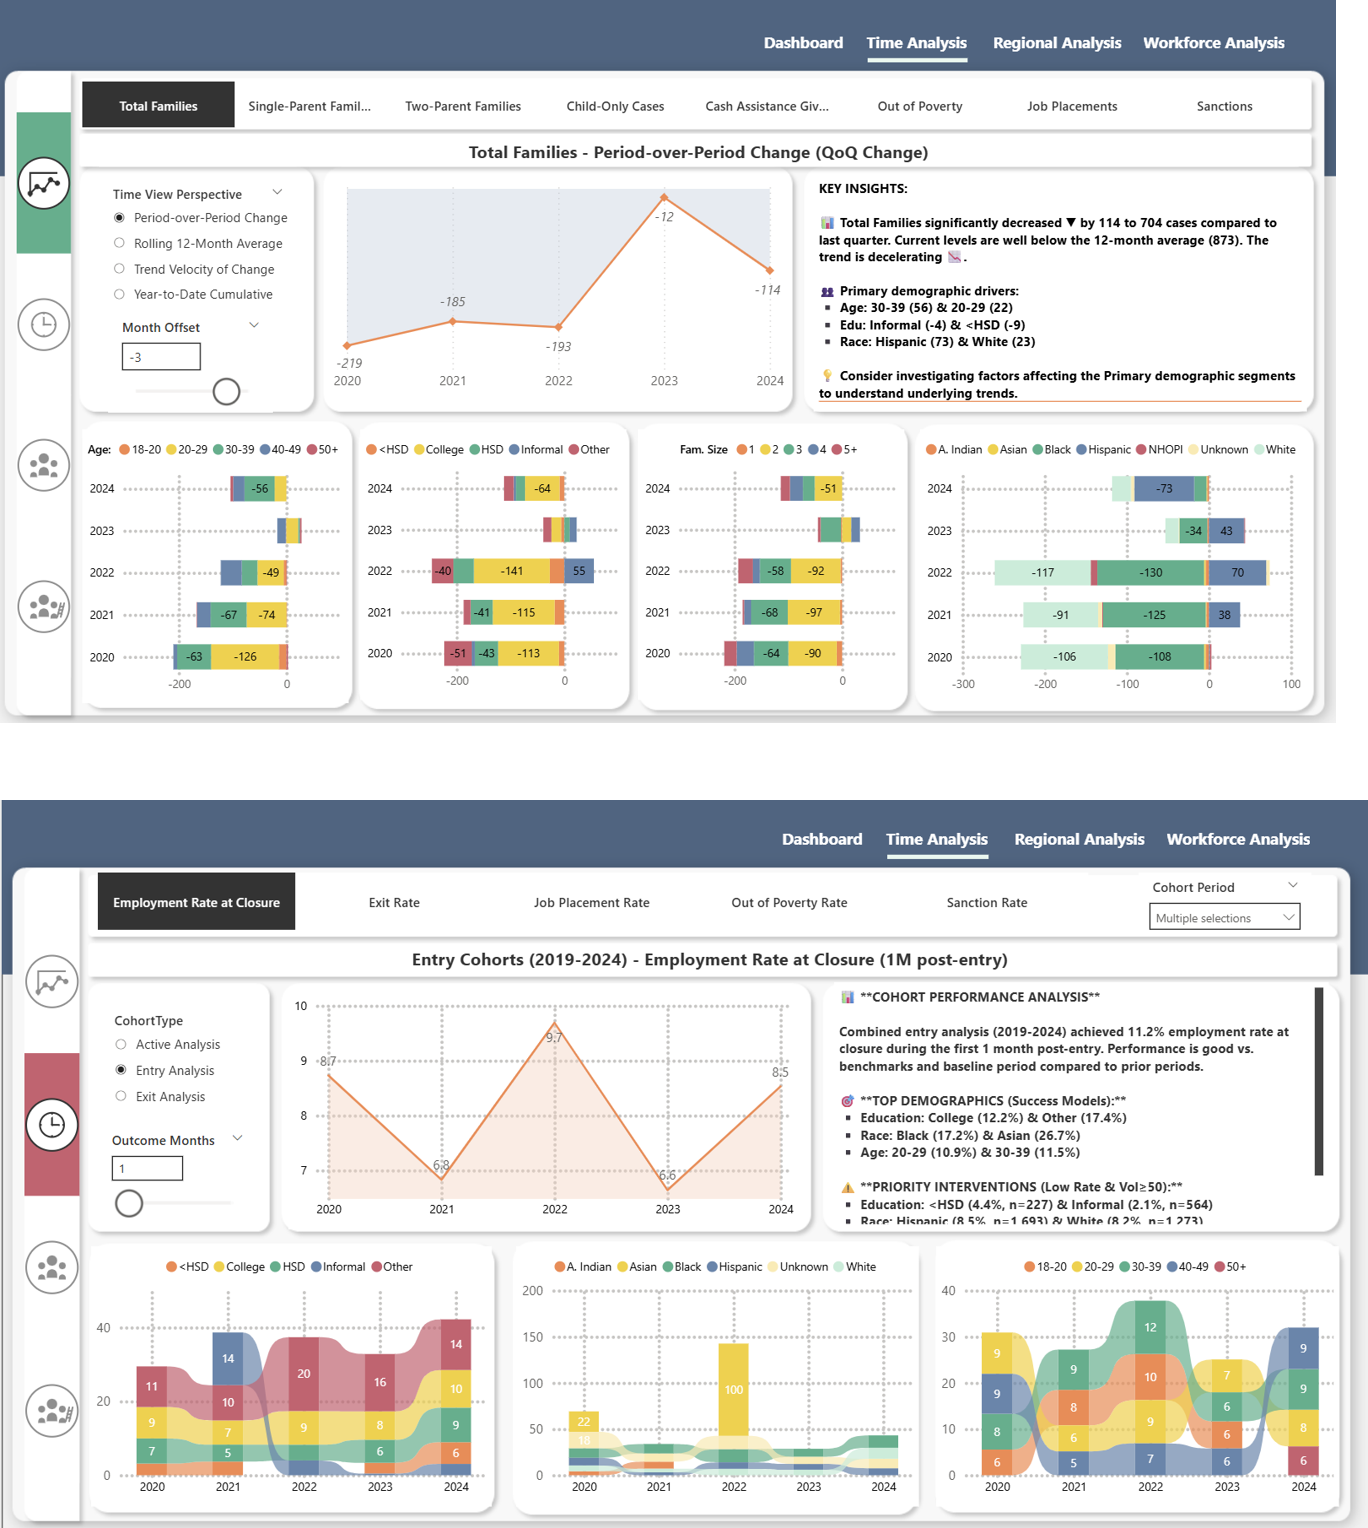
Cohort Analysis
Track entry cohorts through program exit. Compare outcomes across time periods and demographic segments.
Regional Breakdowns
County and regional views that account for local labor markets and policy variation — useful for targeting resources.
Two scenarios we hear constantly
The point isn’t “more dashboards.” It’s answering real questions — fast, defensibly, and with drilldowns.
Stress-testing caseloads, capacity, and outcomes across economic cycles
"What happens to our numbers if unemployment goes up?"
The situation
Economic indicators soften. Leadership needs to know: if intake surges, what happens to caseloads, WPR, staffing capacity, and budget exposure?
Many states answer this with back-of-envelope estimates — or don’t answer it at all.
What Sigmoid Nexus does
The scenario planner models growth against your baseline and historical intake behavior. It flags county-level capacity bottlenecks and produces spend projections in minutes — not weeks.
You get briefing-ready outputs instead of a data request that takes six weeks.
The “what changed?” investigation
"This cohort’s outcomes are worse than last year. Why?"
The situation
Your April 2024 entry cohort shows materially lower employment at exit compared to April 2022. The director needs an explanation before the next hearing.
What Sigmoid Nexus does
Cohort comparison highlights composition shifts, changes in work activity assignment, and sanction rate differences. Drill into segments to isolate drivers.
Often takes an hour to test hypotheses instead of weeks to even frame the right questions.
Who uses this
Different roles need different answers — without forking the truth into separate spreadsheets.
Caseworkers
Cohort-level signals and client history views. See which cases need attention before they churn.
Analysts & Researchers
Synthetic data for modeling without exposing sensitive records. A what-if sandbox for policy evaluation.
Program Directors
Monthly KPI tracking with subgroup drilldowns and capacity/budget implications.
Legislative Staff
Impact estimates for policy changes and exportable briefing material — without weeks of turnaround.
Move past the spreadsheet scramble.
Synthetic-data deployment is typically under 30 days. Demos are ~45 minutes.
Schedule a 45-Minute BriefingGet in touch
Whether you want a state-specific demo or have questions about the synthetic data engine, we typically respond within one business day.
Email: sigmoidintel@gmail.com
Prefer to schedule directly? Use sigmoidintel.com/demo.
If you add a form provider later (Formspree, etc.), this page is already wired for a simple contact card.
If you don’t want a form yet, delete this box — email-only works fine on a static site.